In our initial post [1], we highlighted the significance of mathematically describing a system’s physical state to gauge its level of disorder. This involves exploring probability distributions. Now, in the second installment of our series, let’s further examine the concepts of disorder and probability distributions.
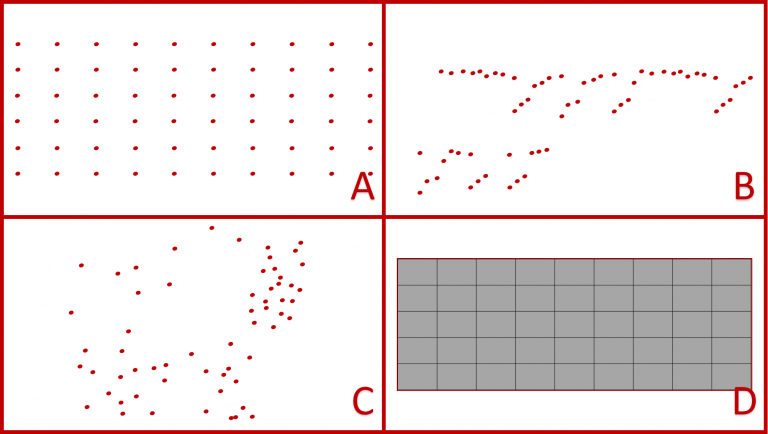
Figure 1: Three potential distributions (labeled A, B, and C) of 60 identical red dots within the same area, alongside an arrangement of 45 identical rectangles forming a grid to provide context for disorder [2].
At first glance, distribution A might appear the most ordered. However, is distribution B or C the most disordered? Without further insights into the system housing these 60 identical points, we can’t definitively label any of these spatial distributions as more ordered or disordered than the others. Context is crucial in describing the system’s state with a probability distribution. Here, the grid of identical rectangles (labeled as D) serves as such a context.
Let’s define:
- pV as the probability of being at any corner of a rectangle,
- pE as the probability of being on any edge of a rectangle,
- pI as the probability of being inside any rectangle,
- pO as the probability of being outside any rectangle.
Following this framework, any spatial distribution of points can be described as (*):
p(X) = (pV, pE, pI, pO).
In this context, distribution A represents maximum order (or equivalently, minimum disorder) (Figure 2):
p(A) = (60/60, 0/60, 0/60, 0/60) = (1, 0, 0, 0).
The probability distributions for B and C are determined by counting the red, orange, green, and blue dots in Figure 2:
p(B) = (0/60, 12/60, 40/60, 8/60),
p(C) = (2/60, 10/60, 30/60, 18/60).
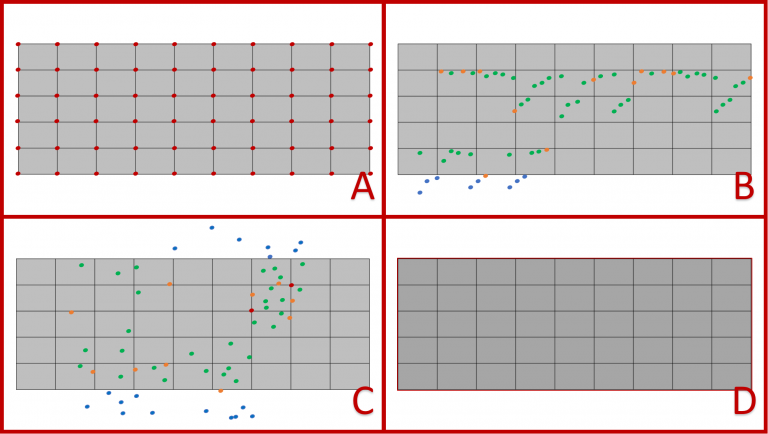
Figure 2: Arrangement of spatial distributions A, B, and C from Figure 1 on the grid D consisting of 45 identical rectangles [2]. To facilitate probability calculations, points located at any corner of a rectangle are shown in red, points on any edge of a rectangle are shown in orange, points inside any rectangle are shown in green, and points outside these regions are shown in blue.
In subsequent posts, we’ll explore how the disorder described by these probability distributions—p(A), p(B), and p(C)—translates into entropy, with values of 0, 1.24, and 1.62 respectively. While distribution A represents maximum order, distribution C signifies maximum disorder. However, this ranking may entirely shift when transitioning to a different context than the grid D depicted in Figure 1.
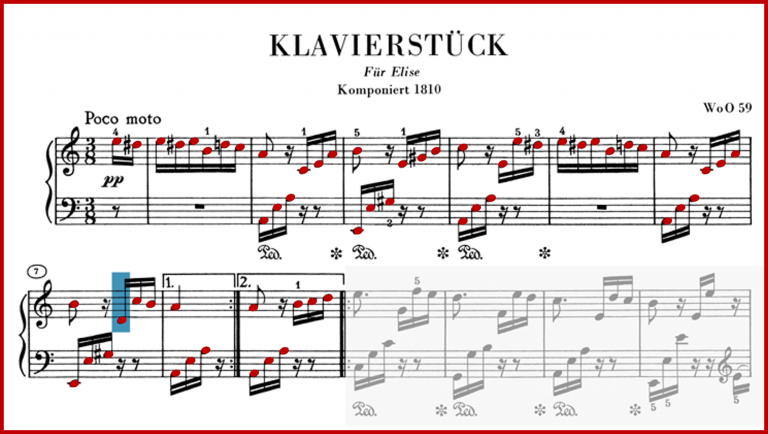
Figure 3: Arrangement of distribution B from Figure 1 on a blank sheet of staff paper over the opening notes of Ludwig van Beethoven’s composition “Für Elise” [2, 3].
For instance, when distribution B is overlaid on blank staff paper, it reveals the opening notes of Beethoven’s composition “Für Elise,” composed in 1810 and published in 1867, a piece recognized worldwide (Figure 3). Similarly, distribution C outlines Picasso’s famous abstract bull, “Le Taureau,” created in 1945 (Figure 4).
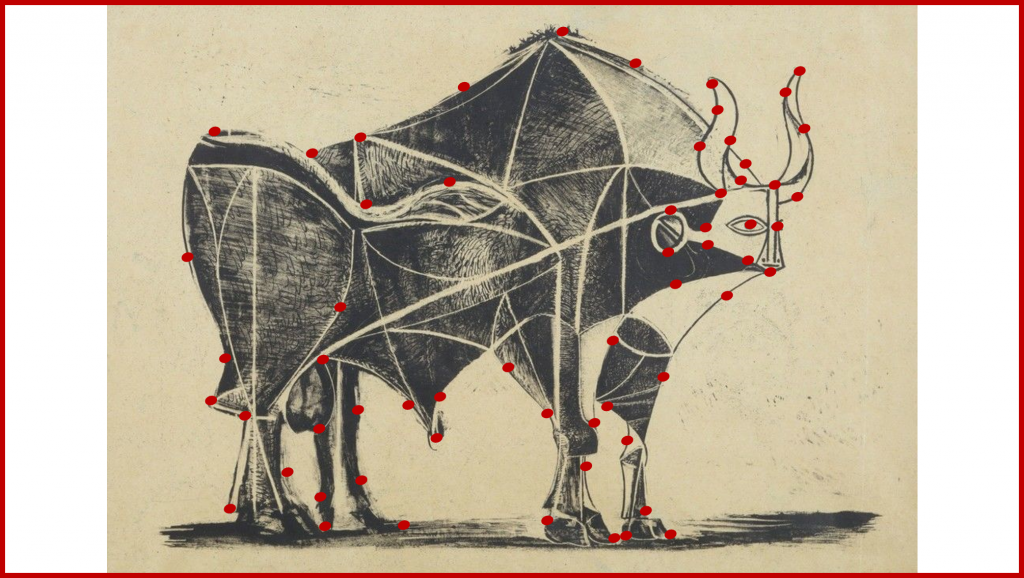
Figure 4: Arrangement of distribution C from Figure 1 on the sixth stage of Pablo Picasso’s lithograph “Le Taureau” [2, 4].
Distribution A’s maximum order property in the grid D context transitions to distribution B in the context of Beethoven’s notes and to distribution C in the context of Picasso’s lines. The grid D doesn’t necessarily express higher order than “Für Elise” or “Le Taureau.” Hence, we can’t independently consider different situations seeming comparable in terms of disorder like A, B, and C without context. Without context, probabilities and consequently disorder cannot be defined.
Stay curious,
Onur Pusuluk
(*) Probability, represented as pV, pE, pI, and pO, is often denoted by “p,” referring to the first letter of “probability.” It’s worth noting that probability should always range between 0 and 1, with total probability conserved: pV + pE + pI + pO = 1.
References:
[1] Check out the first post here:
https://qdiscord.khas.edu.tr/delocalized-ideas-quantification-of-disorder-1/
[2] Visual sources: Onur Pusuluk.
[3] Listen to the piano version of “Für Elise” here:
https://www.youtube.com/watch?v=_mVW8tgGY_w
[4] View all stages of Picasso’s drawing here: